Chapter 1
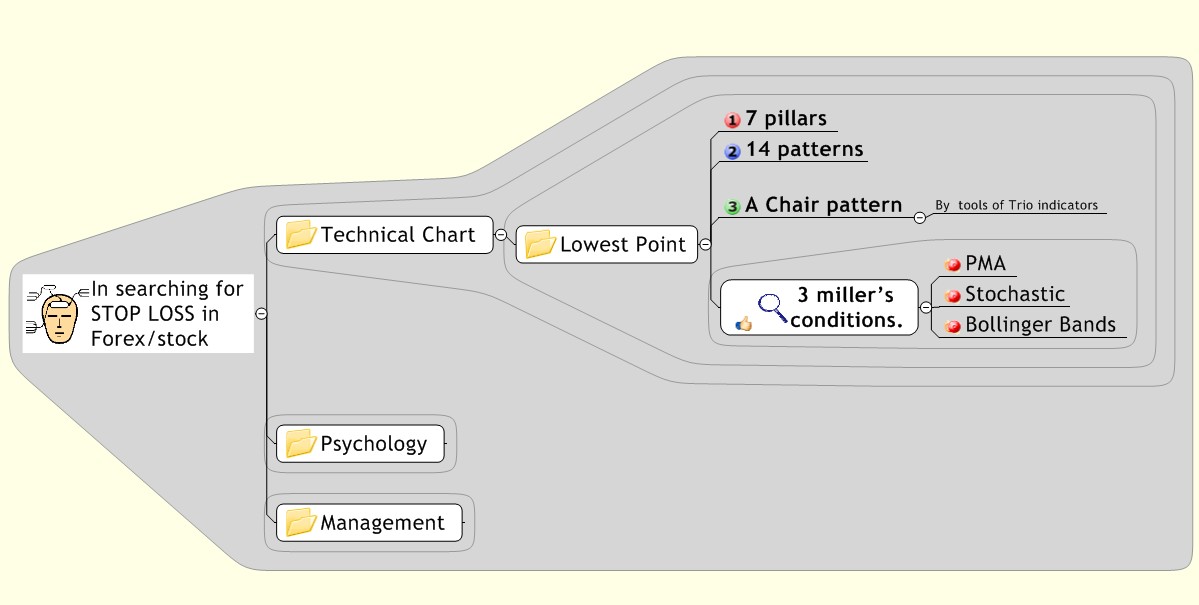
Resistance & supporting line with (7) pillars
Fibonacci line and shit (1)

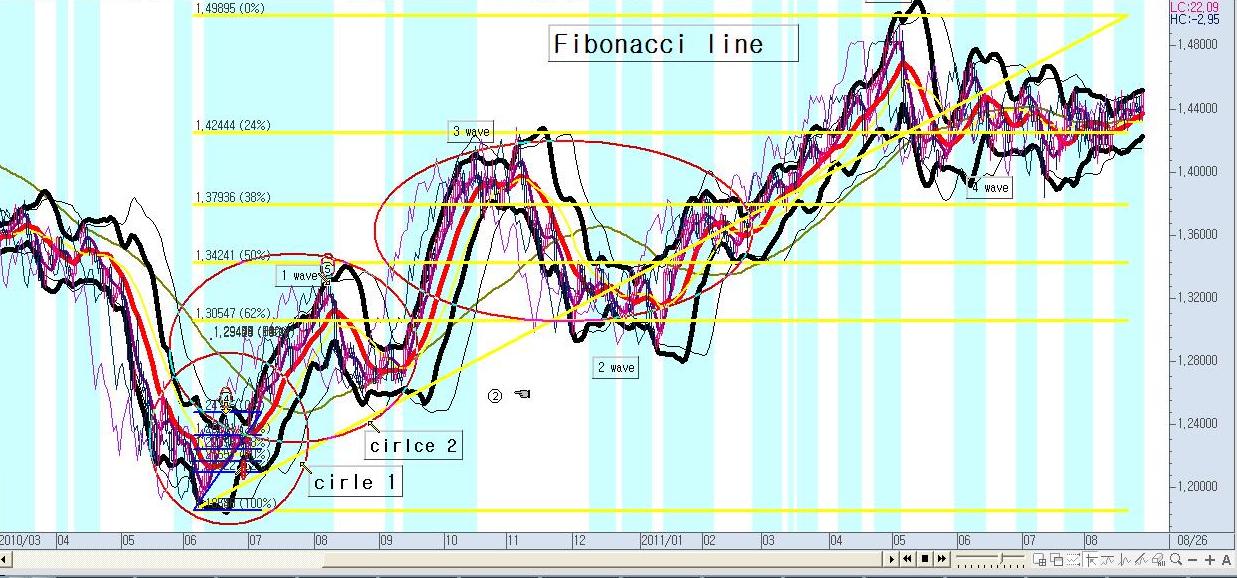
Let us initiate with one of 7 pillars, Fibonacci line.
There are three circles drawn by three Fibonacci lines.
Those Fibonacci line are a perfect accord with all nature agreement with harmony as well as with golden ratio.
① See the circle of ① and Fibonacci as Sub-sub wave of master wave ③ and check it out the 5 wave and 2 wave finger signals ☜
② See the circle of ② and Fibonacci as Sub- wave of master wave ③ and check it out the 5 wave and 2 wave finger signals☜
③ See the circle of ③ and Fibonacci as master wave ③ and check it out the 5 wave and 2 wave finger signals ☜
What did you feel it from my drawing construction?
Anything or nothing or something?
If you felt the Fibonacci line by an idea of fractal geometry, you are not far from its substance.
It is short cut, and is repeating the wave of five finger curve, precisely speaking, it is not breaking rule of principle of wave” unless the wave can be existence.
For it is one of Elliott rule when 2 wave is lower than 0.618. To be called that the wave is not dead, the collective wave should not be lower than 61.8%.
if you check it out the triple 5 wave and 2 wave finger signals ☜,
you may notice that the candle of 2 wave is not lower than 0.618.
It is one of conditions in Elliott wave.
There are three circle and peak of both 1 and 5 wave (I wish you to examine and complete the draw and the practice for the motive wave and retracement wave in each circle, if you know)

Eureka!
It was voice of Archimedes (287?-212 B.C.) from public bath something happening to his symbol.
I am sure, he was surprising enough not so much because of his one is not small nor shabby as because of the buoy from water and rushing out and crying out “Eureka!~ Eureka!
Eureka!
In this time, it is him Elliott, Elliott cries out Finding out the order from disorder from his bullshit! After finding out “Fibonacci ratio”
I am not sure where Elliott finds out his Eureka!
Just I just can premise that the place is presumably no longer public bath room than private toilet where is only undisturbed place by his wife and Where I would sneakily trade and click by electronic trading system
Sorry! I am unable to give you the true but this is only I can give you as a hypothesis since all methodology in Economic is mostly hypothesis and the rest is prejudice like history.
You should partly satisfy with hypothesis as all other theory in this game of social science with premise of postulation.
In the toilet, he was about to find out his artful production of yesterday input of last eaten while he was occupied by something like Archimedes.
He had no sooner stroked out than he glanced at the pile of shit and he cried out “what an artful my production and what a aesthetics it is in a Golden ratio! (At the same time he was surely stroked by Fibonacci I am sure of it)
(Not to be seen shit but a delicious donut hopefully)
And rushing out from the toilet where all the toil can be let
And exclaiming “Bullshit” and Eureka!”
Please do not ask me unanswerable question like kids “which words are first come out of his intoxication mouth, bullshit? Or Eureka?. Eureka? Or bullshit?” Whatever! Either of questions does not so much make useful study as the value of true, but the bullshit has same ratio of our shit which piles up by Golden ratio of Fibonacci sequence:
The sequence of numbers, 1, 1, 2, 3, 5, 8, and 13, in which each successive number is equal to the sum of the two preceding numbers.
Do you think that it seems delicious with perfect ratio? I mean! Donut!
Drill (1-1)
Of Fibonacci line

He Elliott was shocked when his artful production, shit was pile upon with a shape of ratio
And become one of father of Technical analysis after Daw, So that every fellow of him is at least one time everyday pilgrim into toilet for his admiration of worship. (Allegedly we heard)
After that they entry at the point of 62% of retracement and pray for it will be acted as supported line where we should methodically respect it as the supported line.
Queried enough, the diarrhea shit does not apparently match with “Fibonacci ratio” influenced from news
but surprisingly enough, even bad news in side of diarrhea, the piece of shit itself has same ratio “Fibonacci ratio” regardless of size of wave.
It is same shape of miniature of ordinal shit. we shall see it. For there are as many exceptional diarrhea shit as good & bad news especially in stock markets to be distinguished.
And it required almost the power of discretion between normal shit and diarrhea shit from contingencies subsequently.
Meanwhile
How can we be survival from this game without predicting of such diarrhea shit from news, if our postulation is un-precariously based on ratio of diarrhea shit?
Sorry enough! We are hopeless, Nobody but God only knows, even if you know you ate last night, you can’t predict the shape of your shit.
Without that precarious discretion of shits, we absolutely cannot get along any further step on a journey
It will be modest enough if you confess that you are not sure whether if you can produce normal shit or not, perhaps it is one of reason why random theory is prevailed and parasite in this field and why the market is ironically running with this unpredictable diarrhea shit.
we are humbly enough to concede that we cannot precisely predict ‘the necessary and sufficient condition’ for Fibonacci in chart but concede the result which will be happen to your toilet or price board in candle, if you want to be survival from this game.
Unfortunately many people even scholar, especially Elliott flowers will ignore my advice and waste their life to find out perfect rule from Imperfection.
I will say it is also the hummer of scholar. Rather we will be wise if we have intention of not searching for the hummer of scholar but searching for responding the trend and conceding the irregularity of shit in this unpredictable game.
Drill (1-2)
Of Fibonacci line
Let us see this chart.
From this chart, can you any smell of that shit? (As Elliott did it)
If you can, I wish you to skip out of this chapter If not so; you have to lesson more about my dried story
First of all let us diverge “the principle of wave” Elliott and Then we will be converted into Fibonacci since solar system in physic is converted into cell system in biology like fractal geometry.
That is secret an exclamation why Elliott was rushing out from the toilet
If you can do same exclamation from my chart “circle 1” and “circle 3” has common ratio (even more or less) as you can see 24, 38, 50 and 62%.
Let us try to understand the speechless word with wisdom of Silence.
There three circle on chart
First (circle 1) is 1 wave with the ration of retracement (62%) inside of first circle
Seconded (circle2) is 1 wave with the ration of retracement (62%) inside of first circle
Third (circle3) is 1 wave with the ration of retracement (62%) inside of first circle
Hence all circles are rebounded by obeying the 62% rule: such as first retracement as smallest wave of (circle 1) and middle small wave of (circle 2) and small wave of (circle 3) and
The problem is how we can count the wave!
Can you count and draw the wave?
There are 3 circles. You can count wave like this; count the peak of each circle as 1 and 5 wave. You may recognize from point of view that it is depending on
Ø the peak of (circle 1) will be 5 wave because it is peak of (circle 1) but simultaneously will a mere 1 wave, instead of 5 wave, because from point of circle 2, the peak of (circle 1) will be a mere of 1 wave
Ø and subsequently the peak of (circle 2) will be 5 wave because it is peak of (circle 2) but simultaneously will a mere 1 wave, instead of 5 wave, because from point of (circle 3) the peak of (circle 2) will be a mere of 1 wave
Ø and subsequently the peak of (circle 3) will be 5 wave because it is peak of (whole view ) but simultaneously will a mere 1 wave, too instead of 5 wave, because from point of whole view (big time frame) the peak of (circle 3) will be a mere of 1 wave
Therefore
if we can reproduce those processes, we can draw the wave as like as this
However it is totally depending from point of view and not easy for novice to draw freely Fibonacci ratio. Even if they know it is sort of production of fractal geometry they will be hard time to use it.
Drill (1-3)
Of Fibonacci line

It is part of previous chart dissected
You may approach not only Marco view (Kant bee)[1] but also micro view (Bacon bee)
See the No ③ (sub-wave) of whole view, The candle of hammer type is rebounded after touching by No ③ of 62% From No ① to No ④ is 1 wave (as its total view the No ⑤) should be 1 wave since it is depending on time frame.
Hence we may call No ④ as 1 wave ① but No ⑤ is 1 wave too.
In this case, you can create Numbering system as big 1 wave into small wave 1 is (1-1), sub -wave
In this counting system what about No ③?
It is corrective wave as wave 2.
Let us call it as “1-2”
However in this chapter, our main purpose is obtaining supported line from Fibonacci ratio if it is not insufficient endeavor.
In this chart, it is a good case.
See the Yellow line of Fibonacci ratio of from 1~ 5 wave
In such a macro view, corrective 2 wave and 4 wave are supported each by 62% and 38%
This way of processing is that shit is congested not only Elliott one but also your one, shit too.
Do not waste time to be curious for checking whether if American has same shit and same ratio as Korean one.
Of course we are all brother in shit anyway. But do not observe it too long time in there. It is not gentleman’ way of doing.
But know that as long as the shit piling up is same, the Dow Jones and Kospi has same of Fibonacci since chart has no racism, you can apply for any trading of chart.
Drill (1-4)
Of Fibonacci line

This is circle 2
Can you create new the supported line?
Also for its tips, you know now where you are?
Never lost where you are in terms of wave and it’s life cycle
And draw section’s and interpret it by yourself
And can you use them for your real money?
It is risky
Do not trust 100% but just see as a reference.
I know some people would enter here only using the Fibonacci
And saying and showing his account how fate is
And praise what a constancy and reliability of Fibonacci!
I will say he was just lucky and fluke guess and he will be a big trouble soon
However
We can create the resistance &supporting lines on here
The power of retracement
1. 24% (very strong)
2. 38% (strong)
3. 50% (middle)
4. 62% (normal)
5. Less than 62% (the wave is dead and not deserved as wave )
It is reduced from 3 circles into circle 1.
It may be big help for you to feel it, if you inverse what I have process it. I wish you to restore those chart (drill 5~Drill 1). You may get some sensation of it.
Despite of that we are having same ears and same eyes; we can hardly see and hear what it is trying to narrate us.
You can hear as much as you know you can see as much as you know. Whereas it can be a testing tool for blinds or deaf if one can’t or one can.
I know it is not easy for you to dialog with it but you have to utilize its language which is a poem, oracle, wordless words and mute wisdom.
The chart would less speck to here like Wise man Perhaps this is reason why the chart wants to communicate with us as a picture, equivalent with a thousand words in sulky face.
it seems so much to be Greek, an eloquent orator with dazzling tongue, as it seems a Chinese Wise man without words. perhaps the chart regards it as the way of Tao wisdom; “Silence is the beginning of wisdom”
"He who knows (the Way) does not speak about it; he who speaks about it does not know it. He (who knows it) will keep his mouth shut and close the portals of his nostrils… “
I objectively consider you to be understood of his discovering of toilet (Taoism)
Anyway
Compare between 1 wave and 2 waves (in term of sub-wave of upper-wave) (checking out that wave is started and breakthrough by Previous B wave or previous higher point, hence the corrective of 2 waves is concurrent by rule by Fibonacci)
I hope you to not to shy to draw Fibonacci on every wave as like as what I did it
Gaps of candle (2)
It will be more useful chapter not for the Forex but stock trades,Since it is not easy to find out gaps chart from Forex.
I can hardly find out gaps from Forex chart.
It is like the definition of virginity as “extinguished animal in our society.
Hence the gap will be defined as “extinguished a Candle” in Forex chart.
The gap is classified with Common gap, break- away gap and run-away gap and Exhaustion gaps
And displayed and transformed oneself in a conspicuous way of his shape and matrix with combination of those key words such as “Gap up” “gap down” ““Gap run” and “gap fill”
It does not seems to be efficiency way for us to know all about Gap because our main task are not for MBA of doctor degree for diploma but rather be practical soldier, in the face of death and life with real bullet of real money in real battle of war as well as a real lonely warrior as a sniper or green wolf in the Gobi desert of Chingiz Khan.


Let us be smart, accessing to this way, checking for unusual thing rather than mediocre thing, since unusually things have some meaning when usual things is prevailed , -like a nail, stick out get hammered- here
it has same situation. Just neglect normal things but picking up the outstanding candle, regarding them as meaningful price since we get something smelling as the meaningful frontier of war, where bull and bear get something meaningful lesson from battle like human being history lesson of bloody border of the frontier, And we would better to allow them as meaningful historical battle place, defending line as the resistance and supported line

The OP is like steersman of day for trading direction (in this time it would often happened to even manipulate with abusing “the price board” Since OP is usually by product of cheating, fighting, shouting, and drawing for just one candle and is eventually achieved the decoration of medal as the result of war So that would better to pay attention to the OP as much as CP.
See the No ① of hammer type, acted by supported line
The price should be opened at the near point or at least same level price of CP of yesterday
It is jumped up after making big gap between CP of Yesterday and OP of today
You call it No ① as common gap(if it is not filled within 3days).
You can recheck how is working as supported line, because it has not been filled up within 3 days,
Can you see the yellow line?
No sooner had the candle of hammer type reached than it is expressed his opinion as reaction against as sexual molesting.
See the yellow bar of No ⑤ acted by same reason of No ①. It can be regarded as changing the trend, if it is happened at the bottom. Of course if it is not filled within 3 days we can regard it as meaningful signals, when it is jumping up more than 3%.
About the descending gaps, it can be inversely interpreted when it is happened to jump down more than 3%.

We can hardly find out the gap from Forex chart shown as above.
When you see it we would better regard it as meaningful resistance and supported line since we decorate this gap as resisted & supported line
Let us summarize the gaps with my question
Do you think such a gap is happened by the individual player?
If you can move the price up to there with your money, you must be a big guy.
It is rare case that the price is moved up by the individual player. Such a gap is usually by production of sponsorship (or major players)
if it occurred by individual, they must be a big man because individual players can’t concurrent all their opinion into such a point with gentlemen-ship agreement to accumulate stock and to move up there.
(It is also reason why the individualism will be collapsed since they pine for the world not of belly of above but of below of belly) The other hand, sponsorship player, before accumulating stocks, should approved operable capitals or funds from the board of company, unlike individual players.
We would better to stay with sponsorship side because we know that they would play with long terms view of vision and plan
However
The gap does not seem to be something, naturally born at the stage of - Laissez-faire, rather seems to be artificially a manipulation by monopoly of big funding group whom has power enough to distort ‘the supply and demand’
It means the FX market has less volatility in manipulation than share market because FX market has huge enough to buffer trivial turbulence of wave, for it is opened for 24 hours without charging power.
Thou we may naturally see the gap from opening a days in daily chart or opening a week every Monday in weekly chart with discharging power suddenly
Previous high & low price (3)
Let us see in my chart and approach here, in terms of Psychological battle history.
We can approach here with interpretation both accumulation and overhead supply.
If previous high point is breakthrough, it means that the bad overhead supply is successfully consumed or digested.
If the previous lower point is breakthrough, it means that the accumulation is badly collapsed.
Therefore
if the previous higher price is breakthrough by new candle, I would like call him a savior, for it is evil point while they are hard to escape from those trap they can’t sell it because they could not abandon the psychological instinct to retain the prime cost (original capital)
but it is a big opportunity for them to sell those grief, hence the new candle rescue and satisfy all of them who have be snared at the previous higher price point and who spent agitated life and sleepless night with insomnia; (it is process that the bad overhead supply is digested)
Whereas price is up and up beyond the previous point, sweeping out the evil point so that I can hear frenzy hilarity or insanity.
Hence this point is acted as resistance and supported lines we should share with feeling with those misery investors and should remember this point as the meaningful and historical battle point, And enough to be intimated even if it is evil point, for we know that we better known evil than evil we didn't know.
However
It is a story book

① Is supported by ② of previous low line
② Was A wave
③ Is resisted by ⑦ and ⑦ of previous higher line and is hammered down to ⑤
④ None
⑤ Is hammered by ③⑨ and ⑩, acted by resisted lines of previous higher line
⑥ None
⑦ Is acted by resisted lines as previous higher lines once but is acted by supported line at the 5 of ③ since get hammered by ③, ⑦
⑧ None
⑨ Is acted by resisted lines as previous higher lines once but is acted by supported line at the ⑤ of ⑨ since get hammered by ③, ⑦
⑩ Is a shoulder and get hammered by previous higher line after 10th candles until to ⑤ of ⑩ where is supported line of ⑨
Let us assume that you have bought point of ②.
You are Perhaps for a while happy because you create some money up to ⑦ but your greedy did not allow you to ensure the profits. Many other investors have been repeatedly snared by this routine trick.
What a worse! It had come down; (you may lament not ensuring the profits).
But it is as like as life is fluctuated cycle between happy and uneasiness.
in seconded time, as you wish, if the price is reached at another ⑦ point, you may forget your lamenting and create another the hope, but if not, you may disappointed again, even you may feel the fear or in case of extremity, you may give up.
What a lucky! You can get thirdly the point of level ⑦, ⑦ and ③, and at last you clear up with curse at the point of ③ which is the neck line or cup with handle or 3 wave
Let us assume that You are standing at the point of ⑨ right side one, this point is acted as resistance because left side of ⑨ the operator is clearing up saying “ I will not do invest this items anymore “ Hence when you see new higher price it means they digest all of bad accumulation (or volume) and satisfy all them with happy. (So called “overhead supply”)
(This is one of reason why peoples target on new higher price because there is no resistance of previous higher point. We call them trend follower)

The previous point high &lower point are a collection of set points from lamenting and curing as well as of reflecting on the Psychological status of with bad traumas where They all are waiting for a chance and discontentedly eager for doing opposite direction of what they have done before.
Let us assume that you are standing at the point of ⑦ and thinking back about ③ ④ ⑤ ⑥points.
Can you hear something from No ③ ④ ⑤ ⑥?
If the sooner had you seen that point, than you hear the voice of lamenting, or cursing for clearing up their all accumulation of stock that “dam it! Next time, I will never mistake to entry at the price at the points of ③ ④ ⑤ ⑥”
indeed !I think you understand what it is.
But if you not hear any mourn nor any curse but hilarity for heading up those points, I will withdraw all my credit of your capability of chart skill, for you have a mile to go before you sleep since Chart skill with the Communication is most powerful toolkits for survival in this war.
At any rate I have unpredictably been impressed by the industrious candle of the previous high-low price in the virtue of reliability and punctuality more than Germany and Japanese because it is seldom napping and snoozes for Resistance and support line, fulfilled his job without sloth.
Whenever I glance at the left side of the high& low price, I feel somewhat comfortable more than other signals because I can feel the strength of power from rearmament of battle.
In order to participate in war, of course winner side I am preparing(had to be ready at any moment )for my 3 millers tools kit and rearmed with the stop loss, you would better take part in stop loss point on No ③ ④ ⑤ ⑥ because those point from the result of such a war, are acting as resistance line from the view of ⑦ point
(it is resistance on ①② If you not underestimate those point as your potential emery in the future, you are good enough to be a good soldier in war)
Let us Finally assume that you are standing at the point of No ⑧
How did they breakout the resistance line ① ② ③ ④ ⑤ ⑥ ⑦and reach at the top?
What is meaning for that?
And how you feel?
It means there are no longer the barricades of resistance. in another means, the point of bad accumulation of ① ② ③ ④ ⑤ ⑥ ⑦ all have been consumed and digested by ⑧ we call it New high price.
It means any more of resistance. I know some hunters who is aiming only that point we call them a chaser of “new higher price” I think this interpretation is all about the previous high and low
On all the aspect of wholly chart, can you interpret what really happened?
It is disaster and misery
It was huge drop from previous high and low point since it had get hammered by the previous higher point of ①!
Scarcely had the price reached at No ⑧ when the unhappier
said “I will never pee even to the direction of where stock company is located” so that the candle is hammered by ① of the unhappier and rebounded after digestion of compliant of ① whipsaw and eventually Down like the hell (so called ,Oppressed by overhead supply)
Why did they ungratefully pour all the stock into the breakeven price of ①?
We do not know what the hell of human behavior is unpredictable
but we do understand the rage of ① peoples who had been accumulated by wounded and corrosive heart with the heavy uneasiness so that they had been pour all the stock from point of ⑧ with cheating with the whipsaw.
This is for my loose and sloth interpretation of this chapter.
(If we can see the indicators, not only stochastic but also volume indicator, we may surmise that it is point of negative divergence)
I wish you to have some capability of interpretation from chart into story telling. It means you truly understand it (do not invest your priceless time for memorizing the geological Pythagoras’s knowledge but always understand them with reason, such a small difference will make a big difference in future)
If you are able to dialog even mummer with chart like this way, in this time, I will let you know where you are. You are in the process of 5% of our goal
If you are able to make story in drawing of chart into words, if you can, it will be never a small benefit for you.
Keep in mind it is not game to memorize the just pattern of previous high price and low, but game to hear and understand what chart is telling you.
Because chart skill is not same as the knowledge of Quiz show for fragments of information with such general information,
Never go to the battle of war with mass knowledge; for you have not seven lives like cat. You may be dead by the just one shoot of the power of compound interested[1]
Psychological price (4)

① Is line of price 85.000 acted as Psychological price level
② Is line of price 82.001 acted as Psychological price level
③ Is hammered by ① as resisted line
④ Is supported line of ② and ⑤ by lower shadow candle
⑤ Is supported line of ② and ④ by lower shadow candle

The numbers has mysterious power in human world, even such a golden age of Philosophers time it had been worship by Pythagoras In Greece as well as nowadays in China for example as symbol of year and month.
Even vehicle and telephone has been effected by numbers such as 4 and 8 So that the price have been fulfilled by the function of resistance & supported lines
Think about why the Buddha and Jesus has 12 disciples
Even emperor Of Golf, emperor of the night, Tiger Woods had scandal with 12 mistresses and made enough that Calendar Company had to rush to Tiger Woods and offer to 12 ladies for modeling New Year Calendar.
I don’t want to access philosophically this reason what relation a year of 12 months with 12 ladies of Tiger Woods but I want to concede human behavior in this game is affected by mummers hence we consider them as resistance & supported lines.
Let us See the No ①~⑥
Hardly had the line is touched than the price get hammered as Japanese said “the nail stick out get hammered at 85.000 instead of 84.869 or 85.1000.
I am sure that somebody can explain this Psychological price line better than me as mysterious power of numbers. I think we would better not waste time for sure that it has been acted as resistance and supported line.

② Count how many candle is rebounded in side of BBS after black swan
③ Count how many candle is rebounded in side of BBS after black swan
④ Count how many candle is rebounded in side of BBS after black swan
⑤ Count how many candle is rebounded in side of BBS after black swan
⑥ Count how many candle is rebounded in side of BBS after black swan
It seems typical analysis of Bacon bee.
For it is repeated with certain shape in common.
Undoubted, the BBS is acted as resistance and supported lines.
But we would indiscreetly often underestimate these facts and its value
Let us think about this way, if you obtain signal from weekly candle and approach 5 minute candle for making a decision, it may be as like as savor since intraday trader is living on 5 minuet candle
For example case of 2 there 3 black swans candles and rebounded into inside of BBS it means you can get signal of black swan in weekly chart and can filter this in 5 minuet candle where the our traditional heritage are intersected
Let us see other examples

Do not miss the fact that the BBS have trend line. Review specially in those ⑤⑦⑨ which come along with upper line of BBS in this case study chart.
In my world the BBS have more sophisticated meaning than just a signal for resistance and supported lines.
If you combine with trio indicator, my methodology of statistic is enhanced, for example you can combine those black swan with stochastic (533) reached at 80 or 90, because both BBS itself and stochastic have each 94,56% and 80 or 90%.The more you combine with other facts, the more you can get probability.
No sooner had I get to know the higher statistical result of BBS with its lovably personality and character, than I can’t help falling in love with it.
Still I have finest memory when I met BBS, insinuating me with his forehead entrails as his 3 wrinkles of BBS (upper middle and down line) like wise man or portraits of philosophers, smiling me the reliability, confidence and constancy of his words
See No ①~No⑩
And divided them into even/uneven numbers
And count gap (or span) of price between even and uneven numbers!
Hardly had the black swan been breakaway the upper line of BBS when the candle is rebounded inside of BBS From this fact of chart, we can ensure the resistance and supported line between upper line and 5MA or 12MA even 3 wrinkles of all BBS
For example
From No ① into No ② and ③ and ④ and so no, And assuming that you entered one of any candle at the higher price, and then check out the Next candle. Did you find out how much gaps they get hammered by upper line of BBS, no matter of its size? What if it is not daily chart but monthly chart?
It is most respectable facts as depending on the where you use it and how you use it with different timeframe zone, whereas how it is easy to be ignorable fact. Adapting this fact, you may possess at least your one methodology.
Moving average (MA) (6)

It is example for the resistance and supported line.
and is fulfilled very well of function of the resistance and supported line.
But often enough in actual trading we cannot see such as orderly arrangement
Even if we find out as like as above, we may not be helped from this information
Hence
the coordination with other indicator is inevitable. it is ideal function of the resistance and supported line.
① Yellow line of 20MA
② Green line of 60MA
③ Black line of 120MA
④ Acted as supported line on 120MA
⑤ Acted as supported line on 120MA
⑥ Acted as supported line on 120MA
⑦ Acted as supported line on 120MA and 20MA
⑧ Acted as supported line on 20MA
⑨ Acted as resisted line on 120MA
It has some meaningful enough for resistance & supported lines if they insist that the currency flow has been affected by 1,2,3,4 quarterly transaction, since 1 month is 20MA, 3 months 60MA and 4 quarter (240 MA,) has 12 months and 1 year, So to speak capital circulation of money world and by quarterly transaction terms.
Critique of MA
How many anlysist is parasite on MA theory?
It can be cradle of Countless invention or trick of panacea.
This MA has potentially dangerous ensnarement tools when analysts are abusing it even they declare and insist on public newspaper that they find out a secret methodology with MA.
Do not be naive to pay any attention on them.
I have seen so many some peoples who would endowment certain MAs such as 33 MA 75MA 300MA and so on. (It is meaningless to me if I am utilizing 15 33 75 200 MA instead of quarterly transaction terms
If it is happened to good result, it is not because of MA but because of their skill for responding with circumstance But they can hardly wake up from just one of sufficient condition which was by chance discovered as lucky guess.
It is highly improbable that one can predict price with it since there is any longer Eureka in MA, and is any longer chance to encounter another Archimedes, who is going to cry out from public bath “Eureka” and surely there is no secret, matching with magic from MA, You can keep your smartness. Here again, you must access to here with stop loss.
On waking up from such a predilection they became enemy of MA and revenge in transferring all betrayed knowledge to novices. (Like Israeli to Palestrina nowadays after learned how to treat human being from Nazi)
Perhaps I am one of them infatuated by MA and betrayed by MA but I am not transfer MA as expression of revenge in inverted proportion of quantity of predilection with proportion of quantity of hatred.
Anyway such revenge is legally right but morally is a sin.
Even they cannot wake up how it is immoral job, cheating as much as they can and bewitching newcomer with their strange methodology of MA theory. When you heard that they find out some secrete from MA Just neglect or keep away from your masters, because they reinvent of wheel of not MA but of cheating methodology.
Typical Trend lines and patterns (7)
An object in motion will stay in motion
Issac Newton

Ladder pattern (7-1)

It may well be regarded as a distorted rectangle not only of characteristic behavior but also of Psychological status.
All Main concepts from the pattern are finding out common element by inductive logic, since all substance is same as rectangle pattern.
in especially ⑧&⑩ points are shared with resisted line of 75MA, the more intersection of facts, the more you can ensure the possibility

We often heard the ‘one sparrow don’t make a summer’ it is very best explanation of ‘Trend, it means in chart trading we are able to enjoy the weather of springing, mayday of life.
For one sparrow can’t switch “the Trend of spring” into especially in weather of summer. It is power of trend and power of the inertia in Issac Newton world “An object in motion will stay in motion”
I was about to create a chapter about “sparrow and trend” For it is very good example of explanation of” “TREND" since the meaning of “TREND" is so essential to technical anlysist filed. It is one of advantage which the fundamentalist can’t get it.
Meanwhile
Assailed with doubt, how do we know about the period of trend in chart but not in season?
Whereas we have known already about prior knowledge what is meaning of spring and summer and season and also have known that each season is consisted 3 month period.
It is question for us. Even if one sparrow doesn’t make a summer’ we know when the summer is coming. In season it will be presumably within maximum of 3 month, the summer coming at least. But in chart how do we know the length and duration of trend?
It is one of our final tasks to synchronize the sensation between a sparrow in season and a trend in chart
If we can truly sense what is meaning of a summer or springing in season as like as we can feel it in chart, it is one of best and lucrative deal what we can harvest from the skill of chart.
I may reissue this topic “sparrow and trend”
At the moment I want you to partly satisfy with the trend as below
Thicken black line is upper line of BBS
Thicken Red line is middle line of BBS
BBS is another expression of ladder pattern especially the red line has substantially same function of trend.
As mention before, You may recognize this is acted as same mission with same function of Resistance & supporting line as well as of one Traditional trend lines (14) because they are intersected by both conception. It is nothing but just a matter of angle from which side you can approach here.

It is trend of BBS and of ladder pattern, too.
We can enjoy the party until the trend is collapsed with double tops’” signals ( which is inverted pattern of “W” of course it is better if we can company with negative divergence from any indicators)
Those BBS trend between upper and middle lines has more significant power than normal trend line which you may draw as this. It is doubtlessly acted as Resistance & supporting line as well as one of traditional trend line.
You can decline the degree of angle and see as attribution to rectangle.
The methodology of trend has been fulfilled long time since Dow Jons.
Even nowadays many of analysts take advantage of this function as the trend [1]in chart language, which is neither inclination nor constancy but an object in motion in motion in Issac Newton world.
As you can see the No ①~No ⑥ has been busy for his mission for embracing inside of a ladder (ref. Ladder pattern chapter)
See the No ⑦ and No ⑧
Both of downtrend line and BBS of down line are breakthrough and strongly supported by BBS down line. Interpret that when such a case especially the BBS and Ladder pattern is overlapping it. They are coworkers as common interested.
Here of BBS of Middle line and downtrend of ladder is shared with their job. You can see this as bullish phase. In my chart it is expressed by blue background color as you know.
When it is breakthrough, where is it also rebounded?
When is best time to enter here?
The once resistance will be recoiled as supported line. The support will switched as resisted
Hence It will be rebounded to the No ⑧ which his function has been changed from support into resistance line with 70% personal statistic.
I wish you to expend and enlarge this fact not only into this ladder pattern but also into analogous pattern such as rectangle, flag, Wedge and all of triangle. I mean “all “ it is substantially same same but different.
And I wish you to inflate like popcorn those facts with confluence of other indicators for best timing for entry as well

It is same trend as previous one but more clearly we can observe inside of story.
=
I have a question, What if it is not rectangle but flag pattern where post is as the upside down pattern of the flag?
We can artificially decline ladder pattern as above and can similarly interpret this pattern as rectangle Pattern in terms of psychological struggle story between a bull and a bear world.
When you find out some of this pattern as the trend, it does not always guaranty you to earn the money but you have some reason to enter at least. This is one of our final missions for feeling it.
It may be small difference in stock trading but it is big difference in technical analysis unlike fundamental analysis. It will be too luxury to apply to the fundamental analysis here in world of Forex trading.
This is reason why we classify all the patterns in the light of conception from the fractal geometry to obtain the more possibility in chart language as well as We may access to here in this pattern as a tools of logic of induction theory.
When you see such a ladder pattern, you can think about entering at the No ① but not uptrend of it otherwise your psychology will fret and erosive and suppressed by emotional decision.
It is apparently at the moment just two intersection of them the point is confluence both by one of 14 trend patterns and BBS line.
But you may see the more meaningful intersection as progressing of this book. I want you to not have objection that the more intersection of patterns the more possibility.
But I want you to acquire and you to better arm with statistics since we can see as much as we know.

Who said the most easiest things is advise some one and most difficult things is victory in argument from ignorant one.
Perhaps I am doing same things, for in fact It is not easy for us to apply it in real trading because the chart is only displayed after result. But before result it is not same matters.
Hence
it is easiest thing for me to advice you that i can justify the logic only according as what is actual happened.
It is happening as often as eating rice on Korea breakfast and as often as I am poorly betrayed it is too bad trauma to cure it.
Let us see this chart. we know where was best point. But before result, we are human, too human
However Undoubted you know where is hunting point as this
① Is ideal point again
② But I had entered 2 ,for it had provided several reason to bet ; it breakout the previous higher point , C wave and chair pattern even more,
but it entirely betrayed all the probability. If we are not armed with stop loss, do not forget that we are completely forlorn
③ Is first ideal point but I could not expect to be became status of ①from view point of ②
I have sad victory with bad result.
I did it with stop loss. The lessen fee is incalculable not only material but psychological issue
We call it bad trauma. Hence in chart world, keep in mind that We absolutely cannot get along without stop loss. I mean not only this pattern in chapter but also all of lowered point in all chapter
Wedge patters (7-2)

This is wedge ,in one aspect, You may realize that you can interpret the entire pattern as wedge patterns.
Your perception, the way of approaching to the idea is not absolutely wrong.
But it is depending on your visual point of angle with what way you are draw and mostly power of your voice since big voice is always wining from the argument.
Any way you may well regards it as deformational patterns from all kind of triangle because wedge itself is triangle. Substantially it has same functions and same treatment to be handled
For example
Triangles (7-3)

Seeing above chart, Do you recognize what I mean by ?
How many do you create the wedge from this chart?
Hence you can re- write your books in terms of wedge patter as your theory It means you can draw all the chart on your way of wedge. you can interpret Even rectangular (Box) into wedge because inside of rectangular you can extract the wedge.

However
You should not miss why it is appeared by wedge in term of the psychological view.
You may recall the definition of “trend” in Issac Newton world “An object in motion will stay in motion” it is fundamental stone shouldering on the technical chart studying. We dedicate a name patterns as trend.
When all the patterns (14) has the trend, when the trend is breakthrough or secession

You may regard as action against reaction in another Issac Newton world and at the same time.
let us adapt two terms ; ‘trend’ and ‘action& reaction’ into chart language therefore the small circle point “o” is entry point after recoiling from psychological the surge of fluctuation.
Perhaps it is friendly way of conceiving the 14 patterns concept as the entry or stop loss point.

Simply All the main concept of entry point is recoiled back to the trend line as I mentioned before.
I hope it is clear enough for us to handle enough rest of patterns “when we enter and exit from the small circle point “o” as long as it is necessary condition of “trend”
Flag (7-4)

Do you remember this chart?
I used it as explaining of the flag pattern in that time.
The flag is acted as resistance and support line since it is trend.
If you wait for the price is down until touring to No ⑨ of flag line, it is also not bad idea for your strategic.
You can enter here with stop loss. At the moment, the price is not touched yet.
Scarcely had you seen the first when you recalled this second chart of Flag chart for making your strategic, and waiting for your fishnet, I think you are near to 20 % of our goal
Let us cheer up!
However you may simply see flag pattern = as box theory in terms of psychological struggle issue. But it is substantially same.
Moving average (MA) (7-5)

It is apparently primitive shape of rainbow chart.
If you added more MA on normal chart,
you are able to see the rainbow chart.
Both idea are characteristically same life cycle and loosely same treatment but apparently not same.
Anyway
Moving average has correlation with certain period human economic life hence it has influentially some reasons acted as resistance and supporting line.
Ø 5MA is 1 week acted as supporting line. ① blue line (in fact, it is most meaningful signal what we can get from MA, for it has be confluence by all MAs and be started the life cy cycle of MAs(It is higher probability in the light of superposition, orderly inflected)
Ø 10MA is 2 weeks acted as supporting line. ⑨ purple line
Ø 20MA is a month acted as supporting line. ③ ⑦ yellow line
Ø 60MA is a quarter acted as supporting line. ⑤ ⑧ green line
Ø 120MA 2/4 quarter acted as supporting line. ⑥ black line
Ø But at the ① the life cycle of MA is stared from converged 4MAS after recharging the power.

This chart is shown and acted as resistance lines ①②③④⑤⑥ in my chart configuration.
I think It would better save the page for not explain about MA any further but just shortly
it’s fulfill his duty as his one of function of Resistance and support line.
It would not be emphasized that the 60 MA has been busy for my errand in my chart function as specially mission as counting the end of life cycle and end of correction when 20MA breakthrough 60MA as status of gold cross.
Assume this chart is 30 minute chart and Think about what if 60MA can be displayed on daily chart in 5MA. We shall see in MA chapter about superposing of MA.
Converged to power with triple MAs (7-6)

It is perfect example for intersection both Converged to power with 3 MAs as well as both symmetric triangle.
The Power converged by 3 Mas (20 60 120) MA has same reason with Power converged by symmetric triangle. Even the reason has been shared with both characteristic psychological attributions.
As decreasing the down trend line of ③⑤⑦⑨⑩ from pessimistic view,
there are other optimistic investors lines of ②④⑥ for sneakily collection it.
Hence the power is explosively breaking the point of ① where is intersected by both symmetric triangle and by breakeven price of average period value of 20 60 120) MA.
It is also orderly arrangement and orderly inflection of all, 5 20 60 120 MA. I wish you to approach here as the conception of “superposition & interference; for it is intersected conception; starting point of life cycle,
and theory of wave and Psychological settlement in common in purchasing price within certain periods.

It is chart for function of convergence and divergence by confluence with 3MAs
It is All the points are numbered ①~⑤
I have told you that the confluence of three MAs has shared the reason with the symmetric triangle but not told you about the breakeven price of MA.
Remember the converged MAs are points which are intersected by certain period of dealing price.
For example if the triple (20 60 120MA) is converged into a point, It means that the point of 1,3and 6 month have intersected by each breakeven price and prime [first] cost between investors
Hence it is nature to be meaningful points, fulfilled as the potential point of volatility, charging or discharging the energy.
It is hardly said that the convergence has the character of resist & support MA, when MAs has converted into one point.
But at least 3 MA) we may well respect this factor as resistance and supporting line.
I have seen many technicians who are obsessional coherence in predilection targeting on only this point for his bull’s eye to shoot.
See the No ①~⑤
The MAs are 5, 20 and 60MA has been converge into a point
In this fact you can also create your methodology only targeting on just confluence of 3 MA such as the 5 20 60MA not less than 3 MA If you have a big mouth or dazzling tongue in thunder voice.
However wait until the fish come into you net ①~④ and catch him as buying points.
Do not overlook each Numbers ①~④ but observe all throughout your unhurried discretion and feel it and keep in mind.
Critique
It seems not to require many skills such as sophisticated neither Trio indicators, nor Elliott wave, nor even synthetically skill of view as Kant bee, but seem to require the power of memory from geological Pythagoras’s knowledge such as triangle, symmetrical rectangle and parallelogram.
It is not so much tantalizing with superficially geometrical methodology as urging you to come to the betting world with simplicity as likely as calypso, but it is not simple and sweet song as appeared as it is.
If we do not completely understand subtle meaning of psychological struggle on the lines, only approaching through methodology of resistance & supporting lines, it is too dangerous enough to trade real money.
Otherwise we are confronted in the face of inevitability, if we are not better equipment with better suit of armor, since undigested information is a poison in this war.
We would better consider only them as one of three ball, as one of undirected expression of the traditional trend lines, as one of sufficient conditions, and as one of only alternative methodology to be not predicted but responded. In all essential aspects, nothing will be important but this view
[1] Kant bee: define the way of analysis as a characteristic behavior for macro view on chart, with intersection by both induction and deduction.(I would like to name on as Marco view Kant bee, micro view Bacon bee. Refer to Ethic in chart chapter)