Preface
Even to
the professional traders, they can’t tell the Stop loss point from the lowest
point
The
Lowest point, eager to
know, is necessary condition for the loss cut and reversely ,the loss cut is
sufficient condition for lowest point, since traders can’t always success the
lose cut in spite of knowing the lowest point.
Hence
the aim for study of the technical analysis chart is not rather for knowing the
lowest point but than for managing the idea of imagination or visualization of
“the loss cut”.
Without
knowing any criterion or strategic of this, we are predestined to be fail
and any further step such as the retrospection of mind control will be like “put
the cart before the horse” Because Stop loses is another matter of lowest point
which is ceaselessly intermitted and interrupted and disturbance by the
psychological trauma issues as well as money management.
The
rest of further step which is consequently remained only the matter of the
response, the response according as situation of capricious candle point will be
retrospection by dried reason,Since we have been countlessly betrayed and
disappointed by lowest point.
The
royal road to conquer the trading Forex/stock is synchronizing three
master-intersection fields; chart analyzing, controlling psychology and money
management. The Most troublesome field is the chart analyzing.
For the
professional trader, snapshot on time, our target should be predominantly to
melt and to synchronize another three sub-intersection; ‘C wave point, Bollinger
Bands and stochastic indictors, to naked the lowest point in this book excluding
thoroughly lucky guess
The
chart , even to the professional traders, had unwelcome presented so many hard
times, suffering and uneasiness, to decipher the lowest point which will be
revealed by the chapters 3~8, having confidence in that when we know this point,
we may be well armed with fearless kits against the fear.
The
rest of them will be issue for psychology at chapter 9, (Knowing Oneself in
technical Analysis) and will be subject for the Management: at chapter 10(A Game
like Backgammon) and will be issue professional morality at chapter 11, Ethic in
chart. Hence the book is sectionalized by master three parts and by sub-content
three sectors
We
modestly grant that the prediction is God’s territory but not human being. We
are only allowed to access here as imagination and response as necessary
condition of lowest point.
The
loot of ‘Prediction’ is itself confessing as pre (before) + diction (tell)
before you tell something, we have to primordially possess some “idea,
imagination or visualization” for responding a moving target. The ability in this kind of
job seems such a small difference but essentially big difference since the
ability is almost a synonym of knowing the LOSS CUT or STOP LOSS.
Without the idea or imagination, we would better be eye’s shoppers,
shopping for only eyes like in department store but never open a wallet for any
items and click it.
I will
chiefly attempt for the naked that lowest point with my survival kits; two tools
intersected by Bollinger bands and stochastic and a conception of the Elliott’s
‘C wave point “but from time to time
I will
not exclude the collaboration not only from the ancestral heritage such as:
classical 17 trend patterns for drawing resistance and supporting lines,(all 7
factors) but also those typical and traditional three main indicator; candle,
MA and volume in the light of human psychology and also will try to not stingy
about the explications of the lowest point where social science is started and
where is ended by social science
but I
will less ‘stop loss’ as possible, and I will less abuse the panacea for excuse
of “stop loss” We shall proceed (but my reader! Never do entry unless or
otherwise without knowing of stop loss) we must carries those tools in war as
essential weapon before going to the
battle.
In fact
I have long felt that our usual methods for technical analysis, falling along
separate longitudinal sections — Bollinger bands, stochastic moving averages,
candles, Elliott wave, traditional patterns, (except money management, states of
mind, professional ethics, as well as the histories from
technical charts) –
do not do justice to the unity of real trading for the purposes of
creating money in the technical analysis, even all indicator, should be written
collaterally as well as linearly, synthetically as well as analytically on one
chart, all for one.
Subsequently It is true that the specific information about indicators are
insufficient for novices and
it is natural that required essentially for supplementary reading:
Elliott wave, Bollinger bands, stochastic, Moving Average and candle chart as
basic course. I will not parsimonious about disclosing to unique methodology and
only issuable information which you can’t get from internet recourse.
but for the professional traders who knew what is the those indicator
and more than 10 year experience do not necessary to supplementary reading but
they are required to be majestically a peeping Tom how I am handing it.
There
may be good cause for caution in forming such a view even technical analysis
field as expression of chart language: The probability of error increases with
the scope of the undertaking, and any analyst who promises a synthesis of
indicator fields into one chart, all for one, may become a tragic target for the
myriad of darts that experts can deliver in their critiques. Though I will dare
to venture to display all the fear and greedy by means of those limited 7
components in my chart language
Nevertheless those 7 key factors will be brutally pugnacious to
professional traders as well as novice; skipped all the general information and
even concisely compressed all the composite of elements, it may be hopefully
good excuse that I haven’t solved problem of my bizarre chart alignment which is
totally newcomers as originality Hence I put “the Instruction chapter”
beforehand those 7 keys of my chart tools.
To
begin this investigation of technical analysis, I offer what we may call
“reports,” “On-air, live and from the scene,” through which I describe actual
processes in trading – tales of battle and adventures that convince anyone who
believes in the motto “seeing is believing.”
Nevertheless, the knowledge that investors and analysts have
accumulated, had been divided into two areas: actual trading for the creation of
money, a set of highly specialized processes affecting the supply and demand,
especially in timing, so called technical anlysist; and the candle is
eventually converged
into it’s internal value, so called fundamental anlysist, Both
of these fields have refrained from attempting any view of the whole process of
the creation of yields — whether it be a view of indicators or of presumable
candles; whether to predict their next movement or the effects of
psychological mutation
from greed and fear.
From
that point, we explore the issues confronting each investor: the complexity of a
candle’s movement from the perspective of psychology, in real-time; greed and
fear; resistance and supporting lines. Throughout all, I hold the view that “to
be practiced a shortcut to learning or even better to be majestically peeping
Tom how I am trading in toilet sneaky”
First(unless
introduction charpder is first one )
chapter will be opened the results of my bank account how is fluctuated, luring
as “On Air, Live from the Scene” to the Tom, peeping in my toilet.
Thus It
may be very unfriendly to general users (novices) but professional traders who
has experience at least 10 years, will catch the point “how come?” and “with
what tools,” this guy is catching the fish! Hence the process of the curiosity
will be deductively narrative as 7 survival factors.
How we
are exposed, scared before money, and assailed by thousands of fear and greedy
before money in trading according as candle’s dance. Since trading is 70%
psychology, rest of them, technical issue.
In
first chapter If you don’t know any lines on chart language, never mind, you
will be gradually intimacy what is and how to read it. This is my final goal to
be reached at though this progress in introduction chart.
But I
am strongly insisting on that you must see first the account how is increasing.
Tempting enough let us eager to listen what chart is telling us, and examined
the lowest point well and truly, if not, let us turn away from my chart language
unless the reason and logic has failed to guide and persuade you there.
I want
my readers to share this horrible fear with my chart. It will be huge advance in
this field, if someone feels tragedy drama from chart; I think not less than 5 %
of trades can feel how candle is sung and dance. hence I adapt “on air ,live scene,
how I strife for survivable , from the chart , feeling the uneasy, suffer or agony , it is
almost near to goals, thou, chart language is too difficult to decipher , if you
feel it, it means you understand and listen to what chart is telling to you
about good and bad news.
Perhaps
this is best way for readers to lick my brain and heard my heart beating
throughout live show of battle (I name on it as air live scene from the
battle) This may work,
yes, as a narrative in the first chapter partly, and rest of them, Continued
last chapter. If you don’t want to disconnect the story, you can directly skip
to chapter 13
However
I haven’t invented any of tools ,except my PMA, on my chart formation but found
out what is more like
chemically and statically optimal combination from exposed indicators
under sun, as well as what is for enhancing the possibility of candle movement.
Rather
it looks like irresistible ice-creams. It seems no room for new invention like
‘reinventing wheel’ which has been existed already like my indicators on my
chart, rather what I did, is how to make it only the delicious or irresistible
ice cream since it is secretly matter of chemical combination from composited
materials such as water, sugar or chocolate, which has been already existed.
in this
time I am unwilling to tell you what is water, origin , what is an ingredient of
sugar and what is imported tax on chocolate, rather willing to tell you how to
composite chemically all better possibility, related number and factor for
forging the irresistible ice-creams, Of course for creation of money.
Similarly I am using Bollinger Band, stochastic, MA and C wave, for
the confluence of intersection factors to know loss cut, which has been existed
before me as a famous tools, but not as correlation Numbers to produce not for
the delicious ice-cream but for the earning the money (if you don’t like this
expression let us say “not losing money”) From now on, you may be part timely
‘Peeping Tom’ sees the chart No
<s>43~60</s>, and then you will see this
is real time live show from my chart and account as proof of the loss cut.
The
currency market is much like war, but the fighting is conducted by our proxies,
traders with civilized weapons. As soon as one sits down in a trading room with
keyboard and mouse, one confronts an anonymous enemy who is Faceless, nameless,
and nationless, but who, with one mouse click, accesses the vast arsenal of
e-trading even in toilet. The currency war occurs every day, with a trade volume
of USD 3 trillion.
As we
view currency trading as a kind of war, we can see that the enterprise fits well
into the whole structure and history of civilization. As the Greek philosopher
Heraclitus once said, “War is father of all things.” Such war does not happen
only on battlefields, but takes place even amid the civility of the modern
world, everywhere and at all times in a variety of forms.
In the
currency war, battles are fought between the bulls and the bears,(remember why
we call trading terms as “the bullish and bearish phase”) strife is between greed and
fear. Ultimately, like all wars, it is being fought for the preservation of the
civilization that wages it, for the sake of reproduction and survival.
Thus,
we are marching to win a war, so that we can continue in the trade of life and
in a life of trade. The tools I present – a survival kit for this war – may seem
complex and odd at times. They are probably not suitable for all traders.
It has
often been said that we can achieve this if we know how to control our fear and
greed. However, such a goal is not realistic. Not even the most respected of
analysts could achieve it, as the lives and work of Joseph E. Granville, Jesse
Livermore, or Ralph Nelson Elliott attest.
Secondly, you may not be happy the process of trading, no matter
what, from such as scalping, intraday trading, middle term trading or long term
trading, rather it is the process of your life is unhealthy and dried life and
you may be eventually living on the heavy stress, and Even entirely you isolated
life from community. So many people will agree on that this is not good life
Also I
believe that this is far from wellbeing life but it is busy for producing for
just lonely warrior
Finally
the rest of 95%, losers from this game, we are meant to pave to Bible’s
prediction “He who lives not by the stock shall not die by stock/Forex”
Accordingly my scope of guidance will not be completely happy (even though 5%
winner, survivors)
In
fact, after result, we can make a voice thousand times as different shape for
justifying but before result, we cannot even one voice for the tomorrow price.
We call
it only God knows and nobody know tomorrow price. Even if I do ornament on my
chart about lowest price, I do not really know, only God know and can predict
tomorrow price.
If
someone telling you that he knows tomorrow price, remind them of “power of
compound interested ratio, if he knows it, amassed money like snowball and dying
of too much money” and finally destroyed market run.
You may
ask me what purpose you need to study for this book.
Answer
will be for “responding as circumstance” since it is not territory of prediction
but response
Then
you doubt it again and ask me again
“
Is it
useless as chess game”?
Unless
you are inevitable, have your own ‘principle’ or criterion and access with ‘idea
or imagination of its next step from chart’ and execute “stop loss” you may be
far from what you pine for. Hence Keep away from prediction such as stock,
commodity and Forex.
It
would to be unspeakably delightful if I get pardon from my readers not only for
my poor language but also for handicaps of uncovered cultural gap, programed by
Korean soil and soul, in the way of thinking and expressing, since the English
is unassailable enemy to me.
Odyssey Lee
In searching for STOP LOSS point

The first one; the technical chart is our master subject, and
the rest of three directories; Psychology in trading, Money Management, as well
as Chart in ethic will be coordinated not so much for directed influence from
technical analysis as in-directed influence from subordination of chapters; 9,
10, and 11.
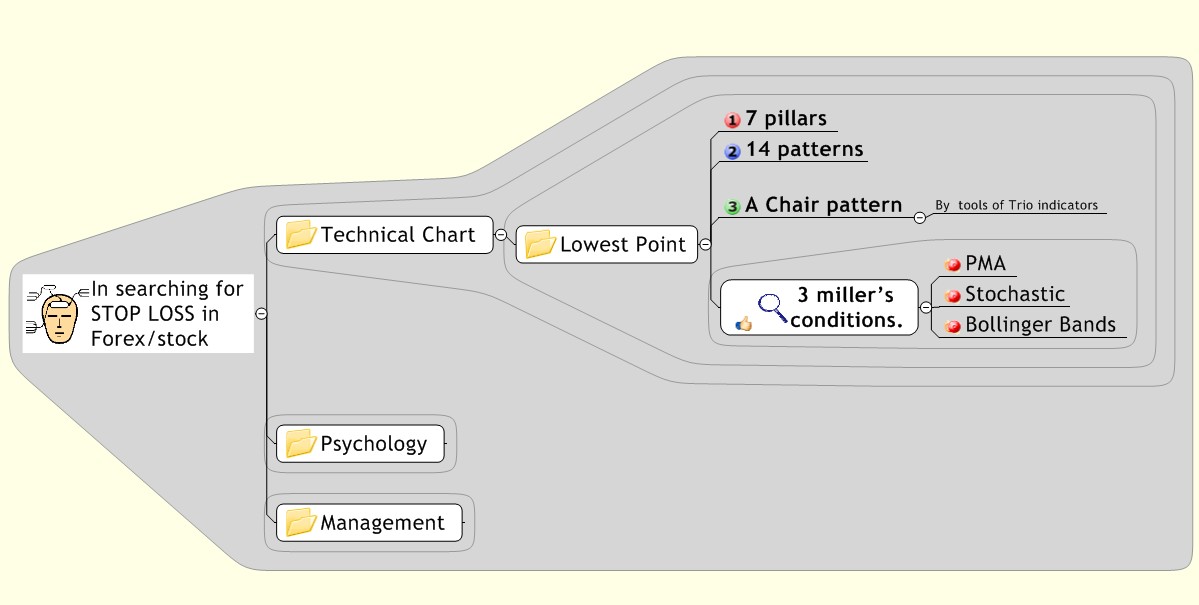
we will try to navigate synchronous those three sub- subjects (3 balls) on 3 miller’s conditions, by tools of Trio indicators, for we will try not so much to dig up its internal value of the bottom price as to naked it’s timing as general as chart anlysist
we will try to navigate synchronous those three sub- subjects (3 balls) on 3 miller’s conditions, by tools of Trio indicators, for we will try not so much to dig up its internal value of the bottom price as to naked it’s timing as general as chart anlysist
Summary of layman terms

In the
expression of Diagram, it will be whole concept for your
brainstorming

For example the process will be combined with
Ø one of master subject
,Technical chart analysis
Ø one of sub- subject, A
Chair pattern
Ø one of sub-sub
-subject 3 miller’s
conditions,


If you successfully synchronize the second step of
sub-subject,
you may finally well reach at the process of 3 miller’s
conditions with Trio indicators.
Its uses not only were so varied but also were reliable signals, and I would be always propitiated from them.

Meanwhile
It has always been an endless game to chase the lowest
point; it is a challenge to build on the work of the pioneers who came before
us.
In this method, which is a new combination of previously
established methods, the path to the lowest point lies in three directions; the
“chair pattern” modified by my "3 Miller traditional trend lines (14) pattern”,
and the “Resistance & supporting lines (7pillars)”,
and is supposed to be indicated by the “three Miller conditions” Rather than depend on any single of these measures, statistically speaking, it is advantageous to seek the optimal stoichiometry of all three.
and is supposed to be indicated by the “three Miller conditions” Rather than depend on any single of these measures, statistically speaking, it is advantageous to seek the optimal stoichiometry of all three.
However, this does not constitute a 100% guarantee, but a
much better-than-odds certainty. Remember there are no necessary conditions for
lowest point but only sufficient
conditions.
Even for professional traders, it is seldom distinguish the
Stop-Loss point from the lowest point of a given graph series.
The Lowest Point, we should be glad to know, is a necessary condition for the Loss Cut Point and conversely, the Loss Cut Point is a sufficient condition for the Lowest Point, since traders can’t always succeed at the loss cut, in spite of knowing the lowest point.
Hence the aim for study of the technical analysis chart is
not rather for knowing the lowest point but rather of managing the idea or
visualization of “the loss cut”. Without knowing any criterion or strategy such
as this, we are predestined fail and any further steps such as the retrospection
of mind control would be putting the cart before the horse.
Because Stop Loss is also related to the lowest point it is
unmitigatingly disturbed by psychological trauma issues as well as money
management issues. (From the part of preface)
Bon
Voyage!
-End of Summary of layman terms-
Volume I
Instruction
of Our traditional heritage
Chapter 1
Resistance & supporting lines
with (7) pillars

Our terminus in studying chart is the bottom of price
candle, shown as above, but we rarely convinced for those point whether if it is
real McCoy or not.
I will attempt to create several resistance supported lines
on that original with selected 7 pillars and of course, it can be re-checked and
can be detective by my 3 millers with intersected conditions of 3
directions.
I am highly yearning that it is not a fruitless attempt to
ensure the better probability
My task is to guide your entire intention for focusing all
energy on those retracement waves, nothing but that corrective wave such as A,
especially in C or E wave.
It must be intersected by one of 7 pillars
requirement, shown as the above diagram, intersected by
my (7) pillars as bellows pattern, which should be one of three directions.
However in any sense of
simplicity, your brainstorming of key diagram
will be processed as bellow
of combination.


Finding out the bulls eye, we rectify 7 pillars by filtering
my 3 millers. The routine with same process as above in each combination will be
our final destination in this
book
“Not to find out the Resistance & supporting lines from
the chart is not to create the statistic from market” that is all, nothing can
be better expressed but this is main reason why you have to allot time to study
of 7 pillars.
But in actual trading the finding out it is not often
enough to ensure
It will be double defense, finding out those 7 pillars, that
you may enhance the probability, adapting it several diverse time frame charts
rather than just one chart. it makes you comforted, and reliable ,for example if
you find out one of those pillar in daily chart, instantly transmit it into 60
minute, weekly or monthly timeframe chart and synthetically look around as
means of Kant bee.
Personally in my timeframe, I endeavor to obtain first
signal in daily chart as means of chair pattern, and apply those reason into 7
pillars subordinated chart such as 5 or 30 minute chart. It is high probable way
to enhance the possibility from those 7 pillars.

Above subject will be satisfied with 3 miller’s necessary condition of bull’s
eye mark shown as bellow

In sense of structural convenience, I would like to approach here with different angle of conception from the Resistance & supporting line, where meant to be one of sufficient condition of the retracement wave.
It is bull’s eyes, the lowest point, where we shoot on not
with arrow but with logic &
reason.
We can access the lowest point not only from my chair
patterns with my 3 millers but also from the conception of 7 factors (I name on
7 pillars) of Resistance & supporting lines,
because my methodology for the lowest points skills should
be overlapped by one of 7 factors of Resistance & supporting such as:
Fibonacci line, Gaps of candle, Previous high &low price, Psychological
price, Bollinger Bands Moving average, as well as Typical Trend lines &
patterns.
Meanwhile this chapters of “7 pillars” and “Typical Trend lines & patterns” is doubly intersected in common with traditional trend line patterns since Dow Jons which should not rudely ignore, as our heritage of technical chart analysis skill, due to the proof of survivals thorough natural selection Such as: Ladder pattern Wedge patters, Triangles, Flag pattern, Moving average (MA) Converged to power with 3 MAs.
I have assiduously grubbed all the facts where converged into the lowest point; for I have
strongly believed that this is matter of quantity game for assembling our
heritage to enhance the better statistic ; such as 14 trend lines and 7 pillars
for 3 millers condition and to ensure the highest probability from the
precarious fortunes of the
chase.
At any rate
Those 7 pillars have been our heritage in technical analysis field. It is proved year by year and generation by generation and survived by the process of “natural selection” in any sense of a last stander.
Those 7 pillars have been our heritage in technical analysis field. It is proved year by year and generation by generation and survived by the process of “natural selection” in any sense of a last stander.
You may well give them some credit, but not too much for all
your credit to those 7 pillars and you may well share your predilection with
correlated facts for Stop loss.
I wish you to regard it as a means of
tracing one of lowest methodology. Don’t be too
naive too trust them all.
When it is interested with other fact, let us not ignore as
just passing a dog on the street from windrow of your life but pay to curious
attention with my
trio indicators.
Meanwhile it suddenly has been occur on me that perhaps it
was not so much matter of finding just those patterns, as matter of chemical
combining with that element of facts,
Or as perhaps simultaneity comparing with other chart from
diverse timeframe.
Or as in all essential aspects as
Kant bee[1],
for it was not so much required the brain power for interpretation as comported
with Greedy and fear in retrospection.
Or perhaps it is by
far the most important step for eventually synchronizing
all the factors, on
a larger scale targeting for stop loss

This is my grotesque chart formation, programed to be
unfriendly but to be ensure high possibility. It is shown Elliott wave.
We are going to dissolve the inside of the circle (2 wave)
which is our bulls eyes where there are the Confluence of as all 7 pillars
resistances and supported line, not to speak of other two
balls.
We will repeatedly and persistently try to shoot and shoot
aging it, dissecting in side of circle until it became to be intimate with ours
eyes. It may not be unproductive effort for our journey at all.
“What you can see it” is synonym of “what you get it” or
“you can see as much as you see”
We will diagnosis those bottoms of retracement and bottom of fear (the corrective wave) with my 3 millers after punctiliously zoom in/out, on large scale, this ambushing place.
We will diagnosis those bottoms of retracement and bottom of fear (the corrective wave) with my 3 millers after punctiliously zoom in/out, on large scale, this ambushing place.
I highly expect that you will be gradually intimated from a
sort of xenophobia of my chart
formation.

It is part of previous chart, where is zoomed in those parts.
Let us see the inside world of my grotesque chart what is
going on, zooming in/out, details drama inside of circle. It come to us
clear enough to be diagnosis with my tools.
In fact it is displayed all the 7 pillars, I know, it is
obscure lines enough to suffocate your breathe and brain. It is still Greek to
us.
Can you find out where are confluence 7 pillar of in this
chart
Yes See ④ and ⑤!
scrutinize those points since it is my hunting place but ⑦ and ⑧ I will narrate later in stochastic chapter in my trio indicators[1]
Anyway
Have you looked your circumstance back where we are in the
light of Macro view?
And have you feel some sensation for synchronizing the fact?
Yes! See ④ and ⑤ circle marked, red color marked, zooming in/out, Using the scroll
bar function so as to zoom in and
out.
Those two points are the Eldorado where has been gold mine
and been in lowers point within 1 month period, retracement and eventually where
we are heading for The point where are insinuating and luring our attention as 7
pillars, resistances and supported
lines.
Dissolving of that point into its element is the aim of this
chapter.
Meanwhile You may notice that background color both blue and
white which is my personal program to obtain automatically the bullish phase
(blue) and bearish phase (white background).
In side of this wave you can hunt the lowest point.
Regardless of size of wave, I will take place to hunt only in the retracement
wave.
Remember always about your stance where we are, thinking as
a big as you can, comparing related timeframe chart as possible as you
can,
and trying to see whole forest but not a tree as often as you can. I will tell you soon how to achieve such a sensation of navigation, from MA and the wave.
and trying to see whole forest but not a tree as often as you can. I will tell you soon how to achieve such a sensation of navigation, from MA and the wave.
In all essential aspects,
Ask yourself why the point could be some significant and
infatuated by professional eyes?Because it has reasons and is intersected
and concurrent by 7 pillars.
If you have same eyes as professional eyes, it may be beneficial for we voyage as the magnetic like the North Star, a navigator,as long as we can synchronize 7 pillars with the professional eyes
If you have same eyes as professional eyes, it may be beneficial for we voyage as the magnetic like the North Star, a navigator,as long as we can synchronize 7 pillars with the professional eyes
1. Fibonacci line
2. Gaps
3. Previous high price
and low
4. Psychological price
5. Bollinger Bands
6. Trend line
7. Moving average (MA)
See ⑤ again, as well as it’s
vertical timeframe which are ⑦ and ⑧. From the this point of ⑤, the sooner had
you seen 7 pillars, than your wallet had been thicken and heavy, because it is
best ambushing place to hunt whenever BBS is opening as Dynamic stage, which is
one of 3 millers conditions.
Count on with your finger how many do you find out such
intersections of those 7
pillars?
And consider the PMA (Previous moving average refers to MA
chapter)?
I advise you to solve this question on papers, taking it
easy, slowly but surely
In this chart, can you find out where are all the 7 pillars
of them?
And can you be familiar with this chart, now?
You are inside of our main chart.
After “zooming in” I wish you to remember where you are now
and what stance we are, before shooting on the target

We shall proceed to find out those outside layer of target
point, Resistance & supporting lines with (7) pillars since the layer is one
of our ball to be digested before we reached at 3 millers conditions.
End of
instruction
[1] See the Ethic in
chart :Kant bee; an way of access to analyze the chart both inductive and
deductive logic especially approaching in whole chart or multi chart such as in
BBS, MA lines and patterns as synthetic judgment
댓글 없음:
댓글 쓰기